This page was generated from
docs/source/notebooks/grids.ipynb.
Grid Generation and Plotting with PyVista#
[1]:
import numpy as np
from polymesh import PolyData, CartesianFrame
from polymesh.grid import grid
from polymesh.cells import H8, H27, Q9, Q4

size = Lx, Ly, Lz = 800, 600, 100
shape = nx, ny, nz = 8, 6, 2
xbins = np.linspace(0, Lx, nx + 1)
ybins = np.linspace(0, Ly, ny + 1)
zbins = np.linspace(0, Lz, nz + 1)
bins = xbins, ybins, zbins
frame = CartesianFrame(dim=3)
The PolyData class delegates plotting-related jobs to pyVista. Call your objects plot method the same way you’d call a pyVista object:
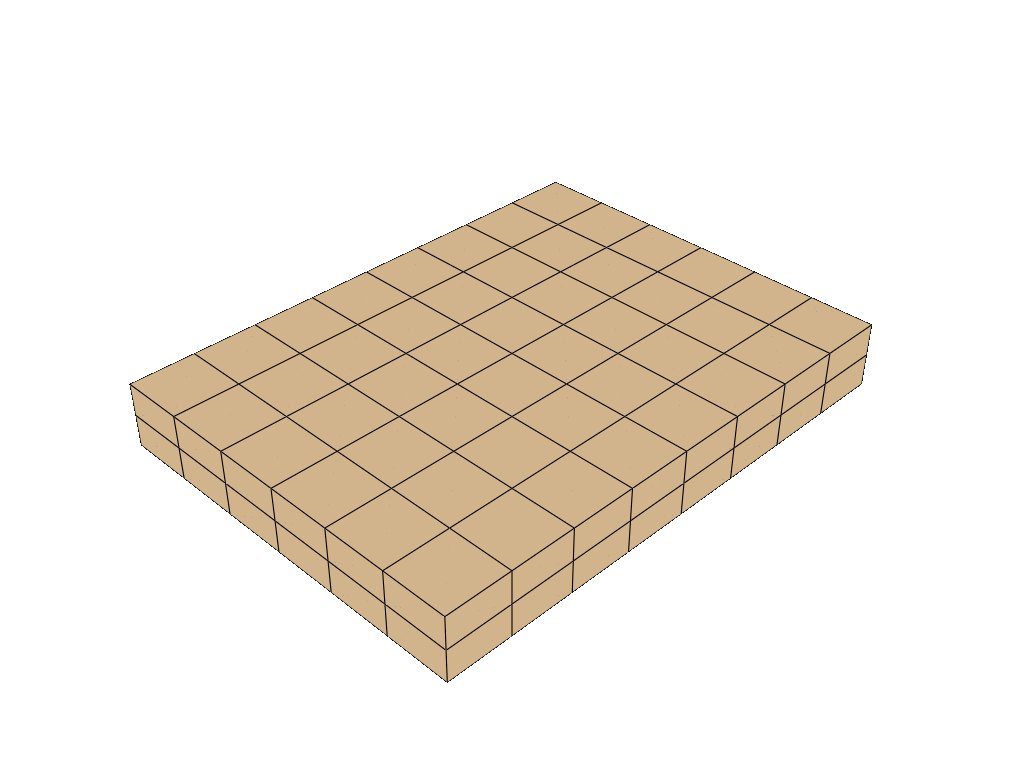
[2]:
coords, topo = grid(bins=bins, eshape="H8")
pd = PolyData(coords=coords, topo=topo, celltype=H8, frame=frame)
pd.plot(
    notebook=True, jupyter_backend="static", theme="document"
)
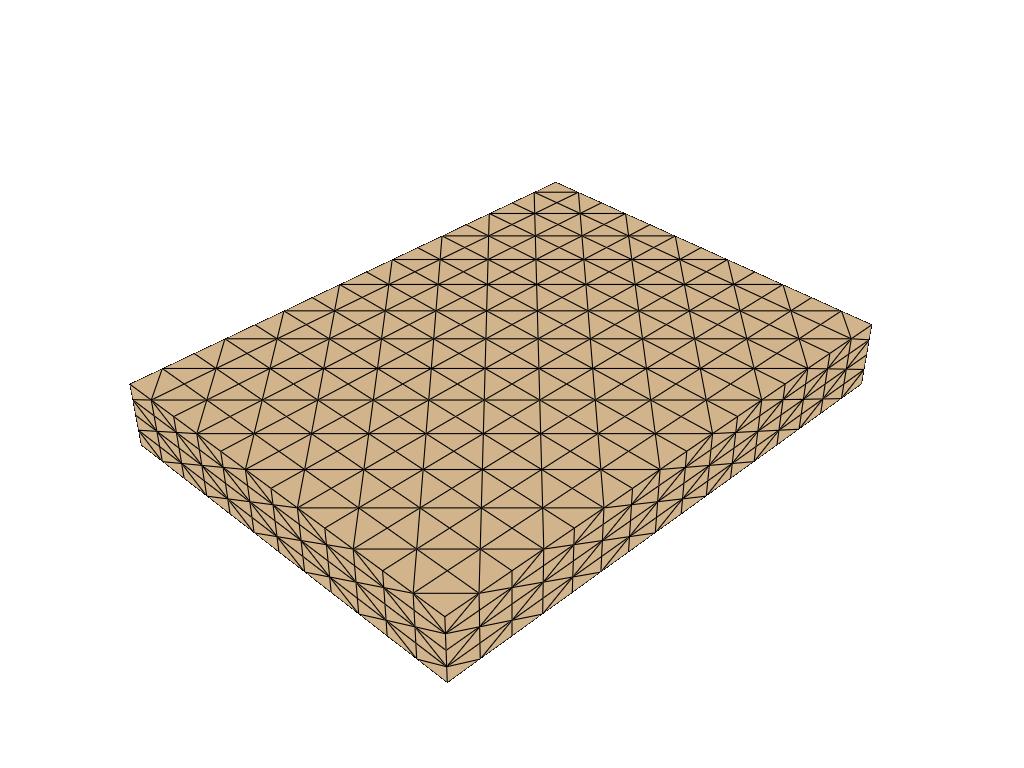
[3]:
coords, topo = grid(bins=bins, eshape="H27")
pd = PolyData(coords=coords, topo=topo, celltype=H27)
pd.plot(
    notebook=True, jupyter_backend="static", theme="document"
)
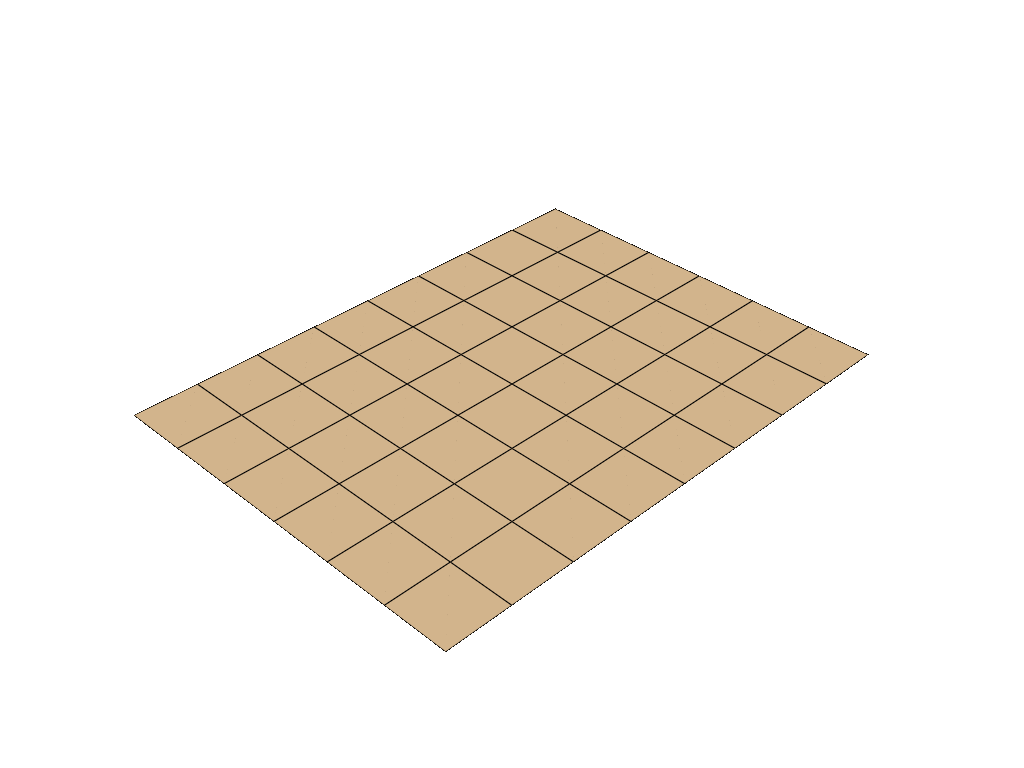
[4]:
coords, topo = grid(bins=(xbins, ybins), eshape="Q4")
frame = CartesianFrame(dim=3)
pd = PolyData(coords=coords, topo=topo, celltype=Q4, frame=frame)
pd.plot(
    notebook=True, jupyter_backend="static", theme="document"
)
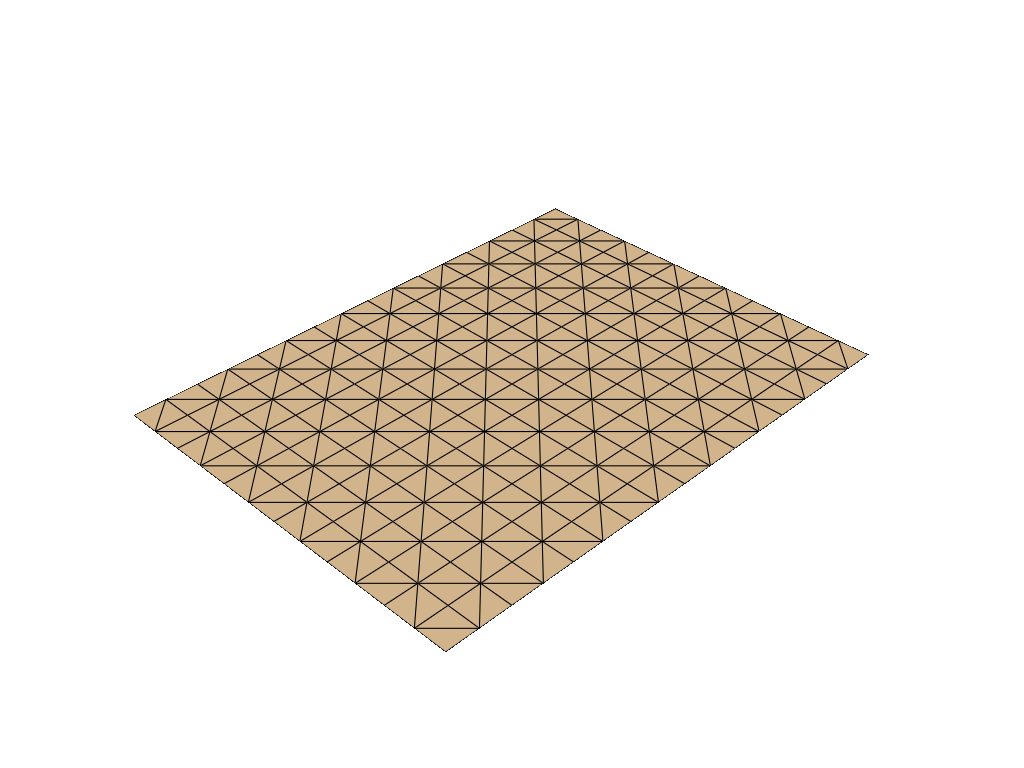
[5]:
coords, topo = grid(bins=(xbins, ybins), eshape="Q9")
frame = CartesianFrame(dim=3)
pd = PolyData(coords=coords, topo=topo, celltype=Q9, frame=frame)
pd.plot(
    notebook=True, jupyter_backend="static", theme="document"
)